Most conversations about carbon in construction start and end with reporting. Fill in the spreadsheet, submit the numbers, move on.
That’s not carbon management. That’s carbon accounting.
There’s a fundamental difference — and it matters more than most precast manufacturers currently realise.
Carbon waste and operational waste are the same thing.
Think about what actually drives your plant’s carbon footprint:
- How much cement goes into each mix
- How long have you been running steam in the curing chambers
- How many elements get rejected and have to be replaced
- How much diesel does the yard equipment burn on unnecessary re-handling moves
- How many empty kilometres do your trucks cover each week
Every one of these is also a cost driver and a production efficiency problem. You don’t need a carbon specialist to fix them. You need better visibility of your own production process.
A simple digital twin of your manufacturing operation gives you exactly that visibility.
What “digital twin” actually means for a precast plant
Forget the 3D animations and the marketing language. A practical digital twin for a precast facility is a structured model of your process that connects material inputs, energy consumption, cycle times, and output volumes, and calculates carbon emissions for each in real time.
Think of it as connecting your batching system, your energy metering, your curing records, your rejection logs, and your transport data into a single picture of what’s actually happening on your plant floor and what it’s costing you in carbon and in money.
This is what our Carbon Tracker system at Lean Precast Solutions is built around. It’s not a reporting tool bolted onto the side of your operation; it connects to your production process via IoT sensors and maps carbon to what’s actually happening on the floor, following EN 15804 standards for carbon accounting. The goal is to give plant managers actionable numbers, not ESG-ready PDFs.
You don’t have to start with full automation
This is the part most people miss. You can start with a spreadsheet.
Manual carbon logging, cement delivered, electricity readings, diesel refills, and scrap counts give you a usable baseline within weeks. It won’t be perfect, but it will show you roughly where your carbon sits per m³ and point you toward the biggest problem areas.
The next step is digitising the human input layer. Tablets on the shop floor, QR codes on moulds, digital batch reports, digital rejection logs. Now, instead of plant-wide averages, you start getting carbon figures per element type. CO₂ per hollowcore slab. CO₂ per wall panel. CO₂ per beam. That level of granularity is where it gets genuinely useful because now you can see which moulds are consistently high, which shifts are wasting curing energy, and which mixes are costing more than they should.
Carbon Tracker™ is designed to support this progression. Plants can start with structured manual inputs and grow into automated data collection as IoT infrastructure is installed without having to change systems halfway through.
Full automation — smart meters, batching software integration, steam metering, RFID on reinforcement cages — gets you to real-time. When Line 2 is running 12% more carbon per m³ than Line 1, you know today, not next month.
Where the carbon actually lives
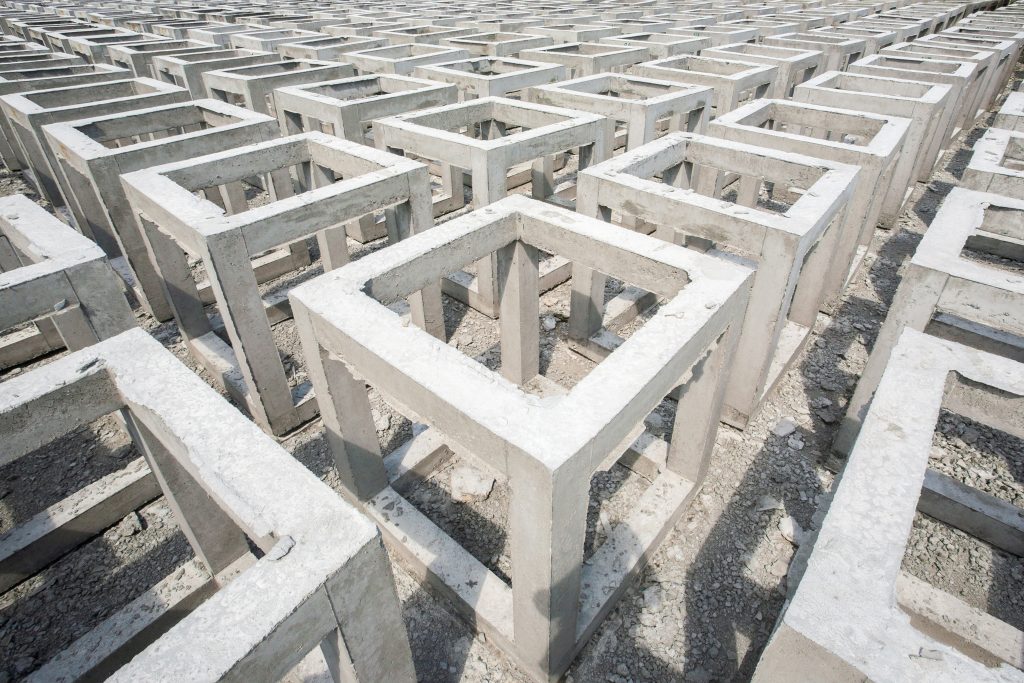
In a typical precast plant, cement accounts for roughly 60–75% of embodied carbon per element. Accelerated curing is usually the second biggest energy consumer. Reject and rework can double the carbon cost of any element that doesn’t make it out of the yard on the first attempt.
A digital twin makes these numbers visible. When your team can see that a rejected double-tee slab costs 500+ kg of CO₂ to replace, the conversation about prevention changes.
The mix design conversation changes, too. You can simulate the total carbon impact of reducing cement content by 10% and compensating with fly ash or slag, while accounting for the resulting changes in curing requirements. The model tells you which route gives you the lower carbon outcome AND the lower cost.
The lean connection
This is worth being direct about: every waste category in lean manufacturing maps directly to a carbon cost.
Overproduction means extra curing cycles. Waiting time means idle equipment still drawing power. Inventory pile-up means re-handling diesel. Rework means double the embodied carbon. Transport inefficiency means empty truck kilometres.
If you’ve ever done a value stream mapping exercise on your plant, try overlaying carbon figures on each process box. What you get is a carbon stream map, a tool that shows you exactly where the waste is, in operational and environmental terms simultaneously. Carbon Tracker generates exactly this kind of process-level data, which is why we use it alongside lean diagnostics rather than as a standalone monitoring tool.
The business case is coming whether you’re ready or not
Carbon taxes are expanding across Europe. Clients in both public procurement and private development are increasingly requesting verified carbon data for each element. Environmental Product Declarations backed by real production data are increasingly appearing as tender requirements rather than nice-to-haves.
Plants that have built even a basic digital carbon-monitoring infrastructure will be in a far stronger position to adapt and compete when that becomes standard practice. The ones that haven’t will be scrambling.
Starting this doesn’t require a large capital investment or a long implementation programme. It requires a clear-eyed look at where your carbon actually comes from and a structured approach to making it visible.
At Lean Precast Solutions, that’s the work we do with precast and offsite manufacturers. If you’d like to learn what Carbon Tracker™ could reveal about your plant, feel free to reach out.
Leave a Reply